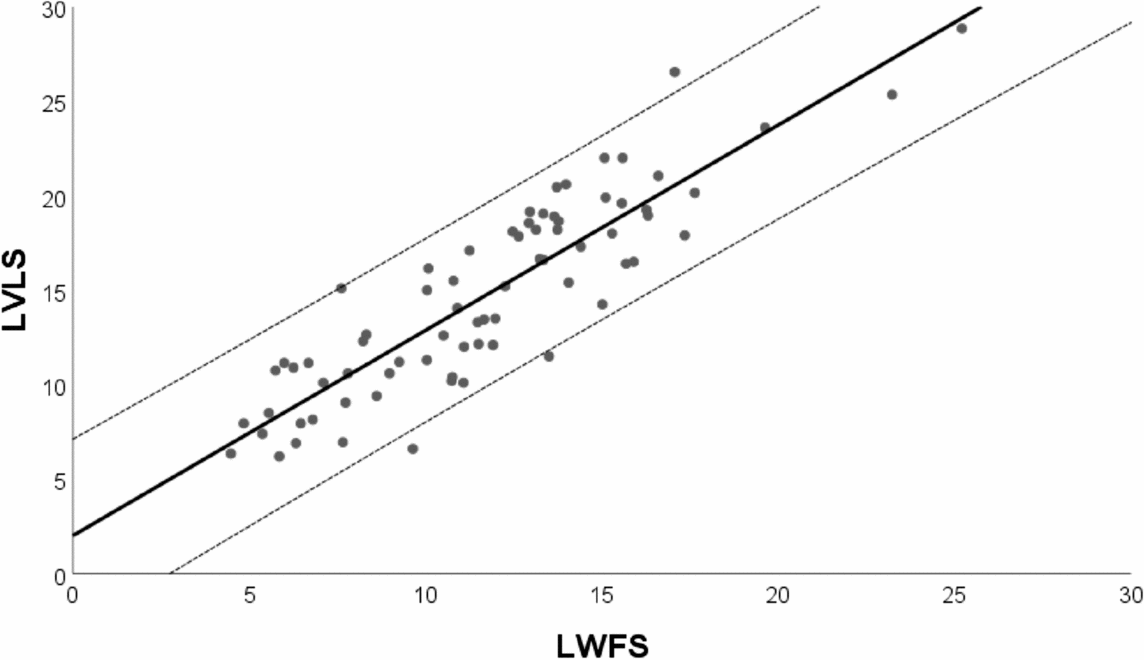
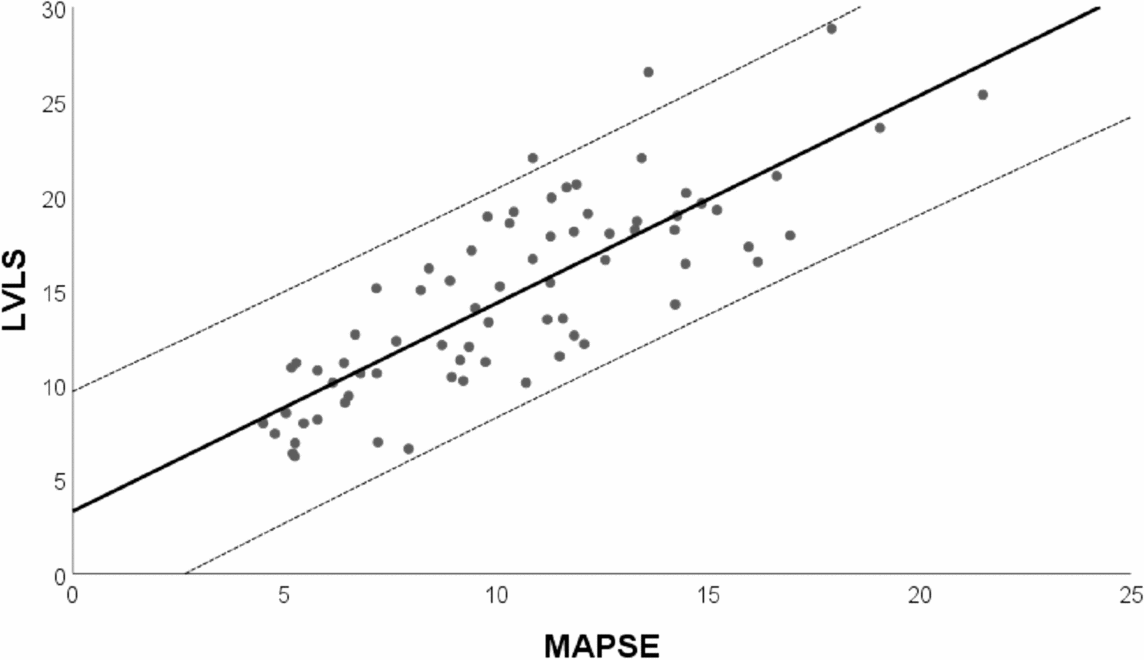
| | Pearson’s r (95% CI) | MSE (%) | Bias (LOA, %) |
|---|
 y = 1.086x + 2.012
 | 0.89 (0.83–0.92) | 5.8 | − 3.0 (± 4.8) |
 y = 1.100x + 3.296
 | 0.81 (0.74–0.87) | 9.1 | NA* |
- *Bland–Altman analysis was not possible since MAPSE and LVLS are measured in different units
- CI confidence interval, MSE mean square error, LOA limits of agreement, LVLS left ventricle longitudinal strain, MAPSE mitral annular plane systolic excursion, LV-LWFS left ventricle-longitudinal wall fractional shortening