| | MSPE | Bias (LOA) | ICC (95% CI) |
|---|
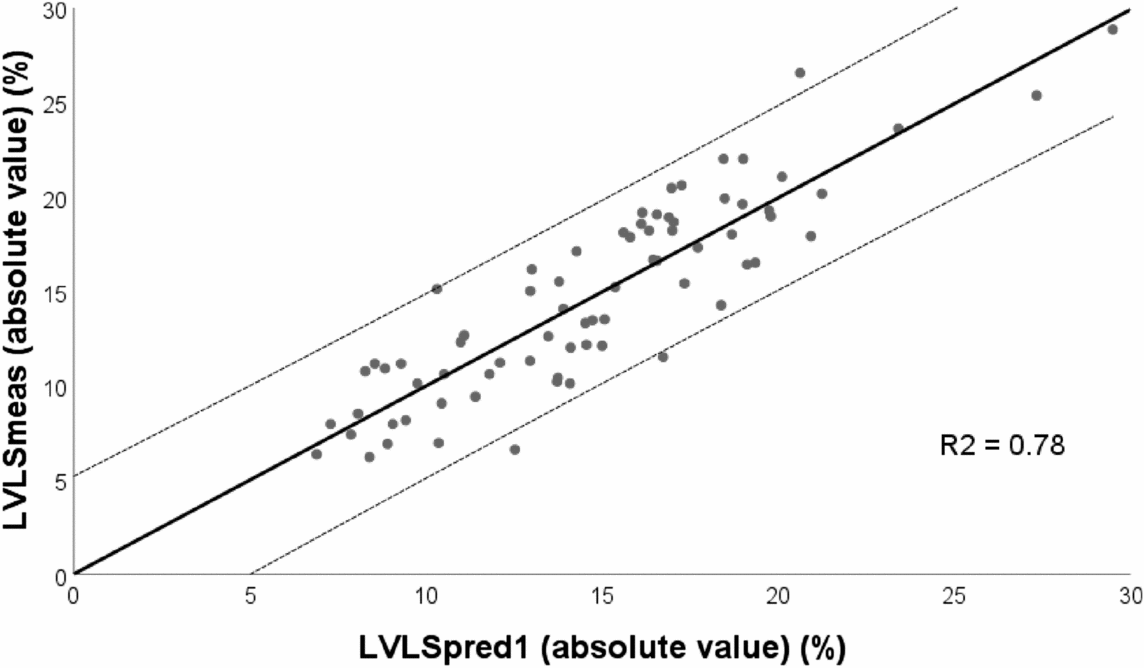 y = 0.997x + 0.007
 | 5.8 | − 0.044 (± 4.7%) | 0.94 (0.90–0.96) |
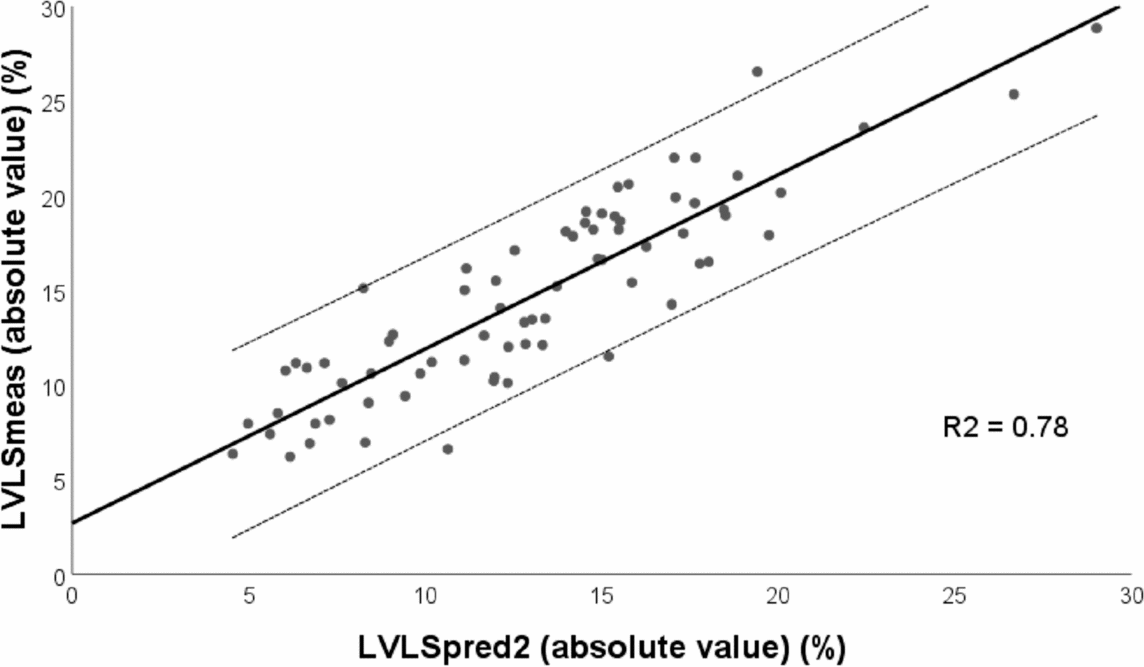 y = 0.921x + 2.691
 | 5.8 | 1.649 (± 4.8%) | 0.94 (0.90–0.96) |
- CI confidence interval, MSPE mean square prediction error, LOA limits of agreement, ICC intraclass correlation coefficient, LVLS left ventricle longitudinal strain, LV-LWFS left ventricle-longitudinal wall fractional shortening, LVLSmeas measured LVLS, LVLSpred1 predicted LVLS from LV-LWFS using the regression equation from our cohort, LVLSpred2 predicted LVLS from LV-LWFS using the regression equation from Huang et al. [14]

